The Ichimoku Kinko Hyo, often simply referred to as the Ichimoku Cloud, is a comprehensive indicator that defines support and resistance, identifies trend direction, gauges momentum, and provides trading signals. It is a very visual tool for chart analysis, developed by a Japanese journalist named Goichi Hosoda in the late 1930s, with many traders using it for its ability to provide a quick overview of the overall health and direction of a market.
Definition
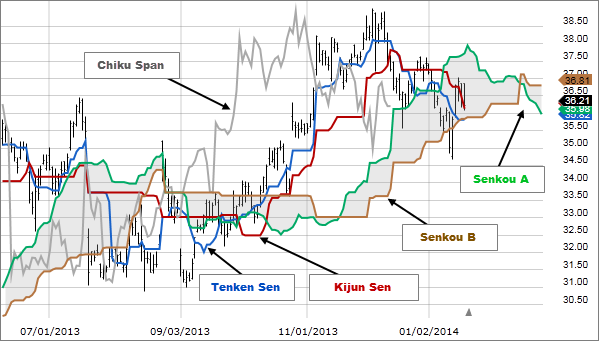
The Ichimoku Cloud consists of five main components that provide an “at-a-glance” view of the market. These components are designed to work in concert to create a comprehensive picture:
- Tenkan-sen (Conversion Line): Represents the midpoint of the highest and lowest prices over the last 9 periods.
- Kijun-sen (Base Line): Represents the midpoint of the highest and lowest prices over the last 26 periods.
- Senkou Span A (Leading Span A): The average of the Tenkan-sen and the Kijun-sen, plotted 26 periods ahead.
- Senkou Span B (Leading Span B): Represents the midpoint of the highest and lowest prices over the last 52 periods, plotted 26 periods ahead.
- Chikou Span (Lagging Span): Represents the closing price plotted 26 periods into the past.
Calculation
Here is how each component is calculated:
1. Tenkan-sen:
Tenkan-sen = (Highest High + Lowest Low) / 2 over the last 9 periods
2. Kijun-sen:
Kijun-sen = (Highest High + Lowest Low) / 2 over the last 26 periods
3. Senkou Span A:
Senkou Span A = (Tenkan-sen + Kijun-sen) / 2 plotted 26 periods ahead
4. Senkou Span B:
Senkou Span B = (Highest High + Lowest Low) / 2 over the last 52 periods, plotted 26 periods ahead
5. Chikou Span:
Chikou Span = Closing Price plotted 26 periods in the past
Example
Assuming hypothetical data for a stock over the required periods:
- Highest High (last 9 days): $110, Lowest Low (last 9 days): $100
- Highest High (last 26 days): $120, Lowest Low (last 26 days): $90
- Highest High (last 52 days): $130, Lowest Low (last 52 days): $80
- Recent Closing Price: $105
Calculations would be:
- Tenkan-sen: (110 + 100) / 2 = 105
- Kijun-sen: (120 + 90) / 2 = 105
- Senkou Span A: (105 + 105) / 2 = 105 (plotted 26 days ahead)
- Senkou Span B: (130 + 80) / 2 = 105 (plotted 26 days ahead)
- Chikou Span: 105 (plotted 26 days in the past)
Usage in Financial Analysis
- Trend Identification: The overall trend is up when prices are above the cloud, down when below the cloud, and trendless or transitioning when prices are within the cloud.
- Support and Resistance Levels: The cloud shapes provide dynamic support and resistance levels.
- Trading Signals: Potential buy signals occur when the Tenkan-sen crosses above the Kijun-sen from below, especially if this happens above the cloud. Conversely, sell signals occur when the Tenkan-sen crosses below the Kijun-sen from above, particularly below the cloud.
The Ichimoku Cloud is valued for its ability to provide a comprehensive snapshot of market sentiment and potential price moves, making it suitable for various trading styles and time frames. However, like all indicators, it is advisable to use it in conjunction with other forms of analysis to confirm trends and signals.


![Top 1200 UK Companies [FTSE All-Share + FTSE AIM All-Share] – Excel Download](http://store.disfold.com/wp-content/uploads/sites/11/2024/05/top-1200-uk-companies-ftseallshare-aimallshare-small.jpg)
![Top 500 Australian Companies [All Ordinaries] – Excel Download](http://store.disfold.com/wp-content/uploads/sites/11/2021/04/top-500-australian-companies-allordinaries-small.jpg)